
Bring DEX into your existing Splunk data platform with UXM
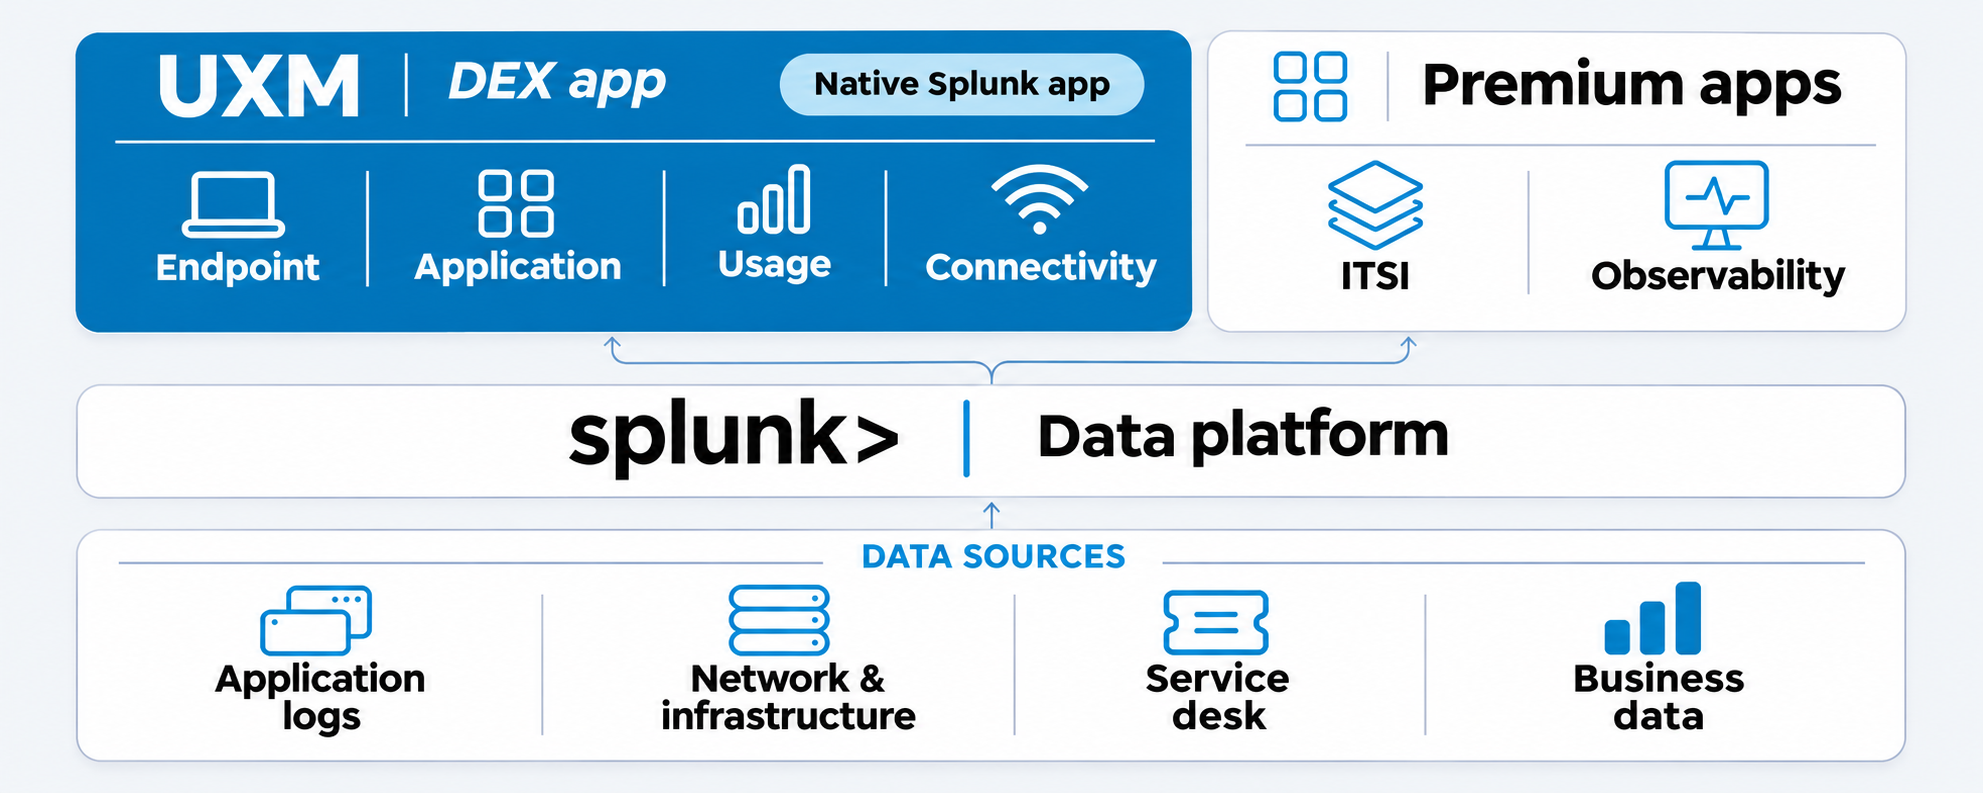
If your organisation already uses Splunk, you have invested in a data platform, connected data sources and skilled teams. Adding digital employee experience (DEX) data with UXM extends that investment to the applications, devices and connections employees depend on.
UXM, our digital workplace observability platform, runs as a native Splunk app. It brings endpoint, application, usage and connectivity insights into your existing analytics environment, where teams can correlate them with relevant data already available in Splunk.
That shared context helps IT investigate disruption, prioritise improvements and make better software and hardware decisions.
Extend the platform and skills you already use
Your Splunk investment includes searches, dashboards, alerts, reporting workflows and the expertise your teams have developed.
With UXM, Splunk practitioners can apply those skills to DEX data, combining experience measures with existing sources and building views for service owners, support teams and digital workplace specialists.
Using the same data platform can reduce the effort of moving information between analytics environments and maintaining duplicate reporting workflows. Teams can extend familiar tools to answer new questions about employee experience.
Correlate employee experience with existing data sources
Consider a finance team reporting that opening invoices has become slow. UXM provides application experience insights. Relevant sources already in Splunk can add context:
Practical example
Why are invoices opening slowly?
- Application logs can reveal errors around the same time as the slowdown.
- Network and infrastructure events can help identify whether the issue is concentrated in one location or service.
- Change records can show whether the slowdown followed a deployment or configuration change.
- Service desk records can show whether the same issue is generating recurring tickets.
These comparisons need suitable searches, consistent identifiers, aligned time periods and appropriate access. Correlation helps narrow the investigation; further checks establish the cause.
Validate changes and rollouts
Connect UXM performance data with deployment dates, application versions and change records already in Splunk. Compare response times, errors and recurring tickets before and after a rollout across comparable devices or locations. Teams can use the evidence to identify regressions, investigate affected groups and verify whether a fix improved the experience.
Connect service performance with business priorities
Business data already in Splunk can help teams assess the impact of disruption. For example, compare application delays with order-processing times, transaction volumes or service backlogs. This helps identify which workflows need attention and whether technical improvements coincide with better operational results.
For organisations using Splunk IT Service Intelligence (ITSI), UXM measures can contribute to service health KPIs through configured searches, entity mappings and thresholds. This adds the employee perspective to the service view and supports prioritisation based on the effect on work.
Make better software and hardware decisions
Review software spend
Where licence allocations, costs and renewal dates are available in Splunk, combine them with UXM application usage insights. Identify underused licences for review and check whether poor performance contributes to low adoption. Confirm business needs with application owners before changing allocations.
Target hardware investment
Combine UXM endpoint health and performance with asset age, warranty and support history already in Splunk. Use the evidence to assess whether a device needs repair, an upgrade, reassignment or replacement, then check whether the action improved performance.
Build the value case around reuse
Reusing Splunk makes existing data and expertise useful to more teams. Where UXM meets your requirements, it may also create opportunities to consolidate overlapping digital workplace monitoring and reporting tools.
Assess the full cost, including UXM licensing, additional Splunk ingestion, storage and compute capacity, implementation and ongoing operations. Measure the value through outcomes such as fewer recurring tickets, shorter resolution times and validated changes to software or hardware spending.
UXM supports Splunk Cloud Platform and Splunk Enterprise. UXM SaaS is also available as a cloud-hosted service.
View UXM compatibility and pricing on Splunkbase →
Start with the data you already have
Choose one recurring digital workplace problem or spending decision. Identify the relevant data already in Splunk, add UXM experience insights and establish a baseline. Track the outcome, then extend the approach to the next use case.
More from the Blog
TURN INSIGHTS INTO ACTION
See UXM in action
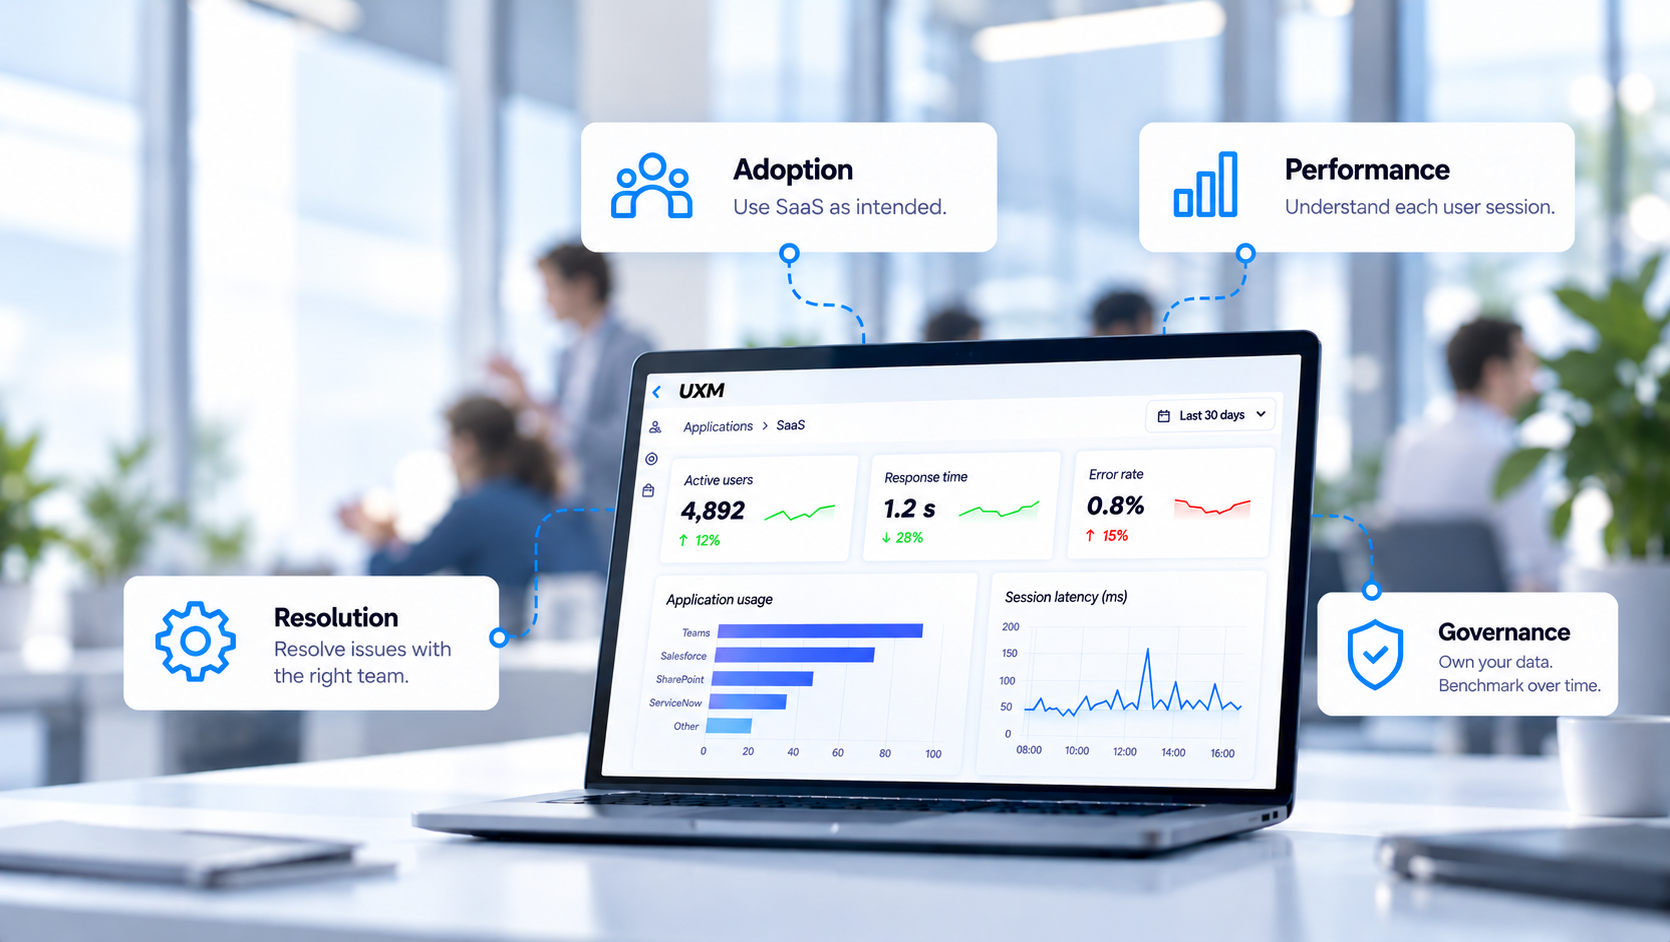
UXM brings performance, health, and usage data together so you can make confident decisions across your digital workplace.
Fast deployment
•Real-world data
•Confident decisions